Data Analyst Interview Questions for Freshers
30+ detailed questions with sample answers — SQL, Excel, Power BI, statistics, HR rounds, and a 7-day prep plan for your first analyst job.

Data analyst interview questions for freshers in India usually mix three things: tool skills (Excel, SQL, Power BI), basic statistics, and your ability to explain a chart to a non-technical manager. You do not need five years of experience — but you do need proof that you can clean data, write a query, and build one dashboard end to end. This 2026 guide lists the questions recruiters ask most often, with detailed sample answers you can practise aloud before Tamil Nadu, remote, and pan-India fresher drives.
At Asmorix Technologies, our placement team runs weekly mock interviews for students finishing data analytics training. Every answer below follows what we coach: definition → example → business context → one sentence a manager remembers.
New to analytics? Read our How to Start a Data Analytics Career Without Experience guide first, then return here when you start applying.
What Freshers Are Actually Tested On (2026)
Hiring managers know you are a fresher. They are not expecting production-grade data engineering. They want signals that you will survive week one: pull a report, fix a broken formula, join two tables, and present one insight without jargon.
Across Naukri and LinkedIn fresher drives in 2025–2026, 70%+ of data analyst interviews for 0–1 year roles include at least one of:
- A short SQL test (live screen share or HackerRank-style platform)
- Excel exercise — PivotTable, lookups, cleaning a deliberately messy CSV
- Power BI or Tableau discussion — often “walk us through your dashboard”
- Statistics intuition — mean vs median, correlation, simple A/B logic
- Behavioral questions tied to projects, deadlines, and stakeholder communication
Typical Interview Rounds for Fresher Data Analysts
| Round | Duration | What happens | How to prepare |
|---|---|---|---|
| HR screening | 15–25 min | Intro, salary, relocation, notice period | 2-minute pitch; research ₹3.5–8 LPA band for your city |
| Aptitude / MCQ | 30–45 min | Logic, percentages, sometimes SQL MCQ | Practise 20 aptitude sets; revise mean/median |
| Technical — Excel | 20–40 min | Live sheet: pivot, lookup, clean data | Rebuild one MIS report from raw export |
| Technical — SQL | 30–60 min | 3–8 queries: JOINs, GROUP BY, windows | 50 timed queries on 3-table schema |
| Technical — BI | 20–30 min | Model, DAX, dashboard defence | 5-min walkthrough of one capstone |
| Manager / case | 30–45 min | “Sales dropped — what do you check?” | Practice structured hypothesis lists |
Startups may combine rounds into one 90-minute session. IT services often split SQL and HR across two days. Always ask the recruiter: Which tools? Live coding or take-home? Is a portfolio required?
SQL Interview Questions for Freshers (With Detailed Answers)
SQL is the highest-leverage skill for fresher analyst interviews. Practise on realistic schemas (customers, orders, products, employees) through SQL training or free databases like MySQL sample sakila.
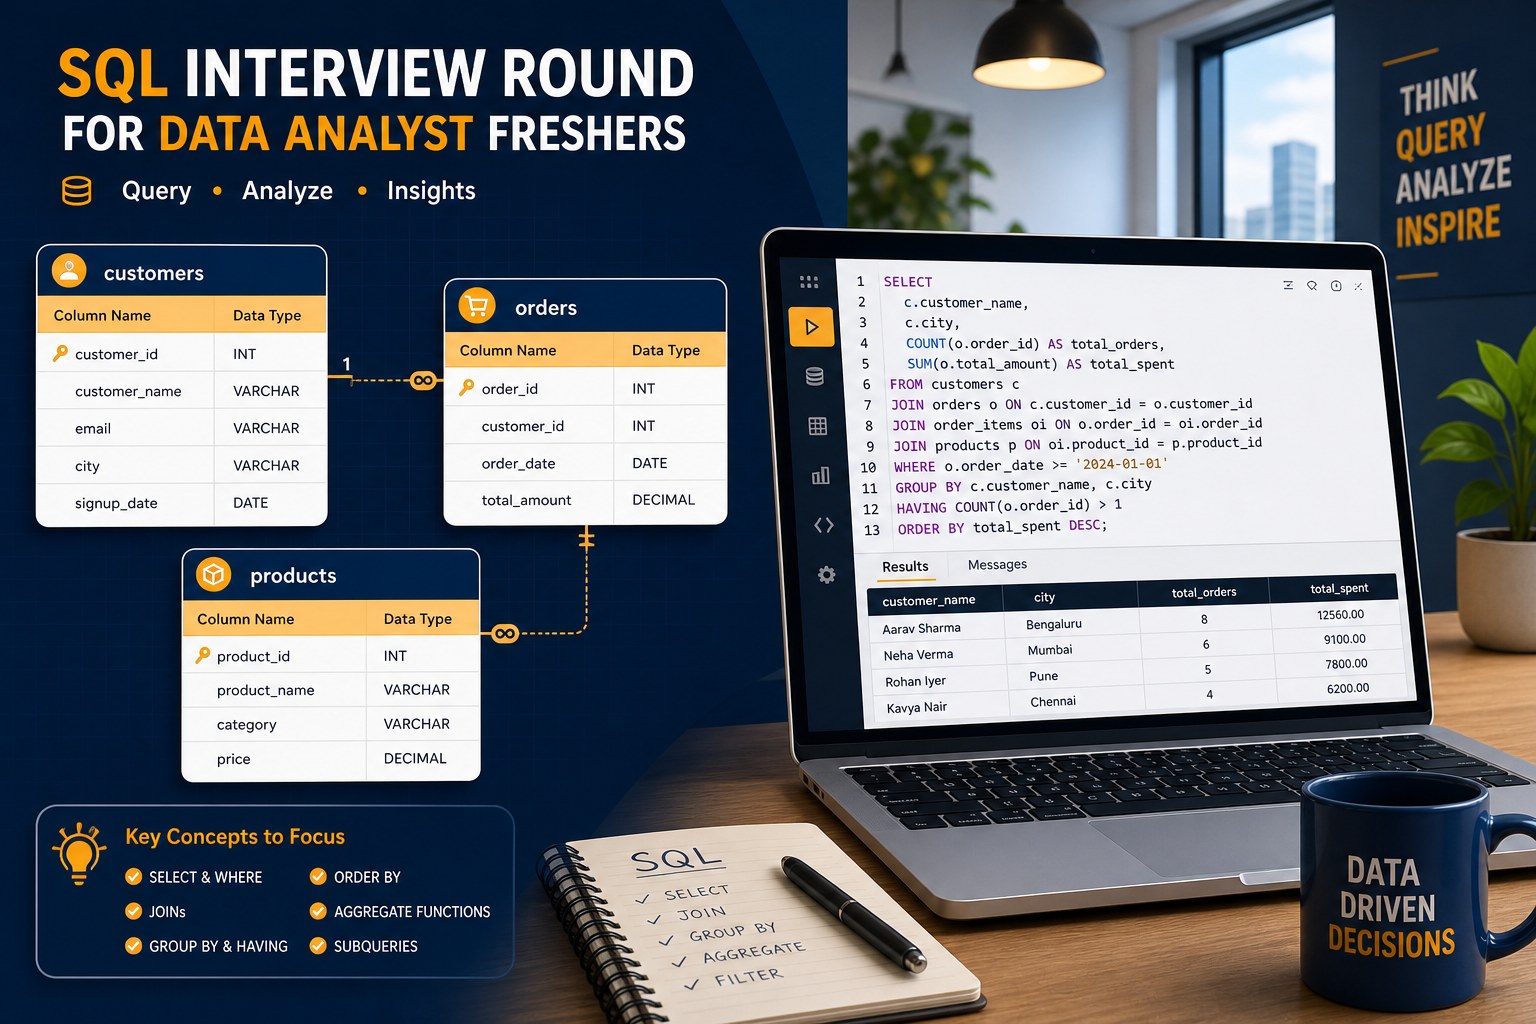
1. What is the difference between WHERE and HAVING?
Why they ask: Freshers often mix row filters with aggregate filters — a common bug in monthly MIS queries.
Sample answer: “WHERE filters individual rows before grouping. HAVING filters groups after GROUP BY when I use aggregates like SUM or COUNT. For example, to list customers whose total order value exceeds ₹50,000, I group by customer first, then use HAVING SUM(amount) > 50000. I cannot put that sum condition in WHERE without a subquery because the aggregate does not exist yet at row level.”
SELECT customer_id, SUM(amount) AS total_spent
FROM orders
WHERE order_date >= '2025-01-01'   -- row filter
GROUP BY customer_id
HAVING SUM(amount) > 50000;        -- group filter
Pro tip: Say aloud: “WHERE = rows, HAVING = groups.” Interviewers nod when you state the order of execution: FROM → WHERE → GROUP BY → HAVING → SELECT.
2. Explain INNER JOIN vs LEFT JOIN.
Why they ask: Analyst work is mostly joining fact tables to dimensions — wrong join type silently drops data.
Sample answer: “INNER JOIN returns only rows that match in both tables. I use it when I only want customers who actually placed orders. LEFT JOIN keeps every row from the left table and fills NULL on the right when there is no match — essential for ‘customers with zero orders’ or ‘products never sold.’ In reporting I default to LEFT JOIN from the dimension (customers) to the fact (orders) so I do not lose entities.”
-- Customers who ordered (INNER)
SELECT c.name, o.order_id
FROM customers c
INNER JOIN orders o ON c.id = o.customer_id;

-- All customers including zero orders (LEFT)
SELECT c.name, COUNT(o.order_id) AS order_count
FROM customers c
LEFT JOIN orders o ON c.id = o.customer_id
GROUP BY c.name;
Pro tip: Draw two circles (Venn diagram) on paper if video interview — visual explanation beats memorized definitions.
3. Write a query to find the second-highest salary.
Why they ask: Tests window functions or subquery thinking — appears in 40%+ of SQL screens.
Sample answer: “I prefer DENSE_RANK() because it handles ties — two employees at second rank both appear. Alternative: subquery with MAX excluding the top value.”
-- Window function (recommended)
SELECT employee_name, salary
FROM (
  SELECT name AS employee_name, salary,
         DENSE_RANK() OVER (ORDER BY salary DESC) AS rnk
  FROM employees
) t
WHERE rnk = 2;

-- Subquery approach
SELECT MAX(salary) FROM employees
WHERE salary < (SELECT MAX(salary) FROM employees);
Pro tip: Ask: “Should I return one row or all employees tied for second?” — clarifying questions score points for freshers.
4. How do you remove duplicate rows?
Sample answer: “First I investigate — are duplicates true errors or valid multi-row events? For true duplicates on a business key like order_id, I use ROW_NUMBER() OVER (PARTITION BY order_id ORDER BY created_at DESC) in a CTE and keep rn = 1. In production I would escalate to the data engineering team to fix ETL — analysts should not silently delete without documenting impact on historical reports.”
5. What is a subquery? When would you use a CTE instead?
Sample answer: “A subquery is a query nested inside another — in WHERE, FROM, or SELECT. I use a CTE (WITH) when logic has multiple steps or I reference the same intermediate result twice — it reads like a story: active customers → their 2025 orders → monthly totals. CTEs make my scripts easier for teammates to review in Git.”
6. Which aggregate functions do you use daily?
Sample answer: “COUNT and COUNT(DISTINCT user_id) for volumes and unique users; SUM and AVG for revenue and ticket size; MIN/MAX for date ranges. I always pair aggregates with GROUP BY on the correct grain — daily vs monthly vs product level — because wrong grain is how dashboards disagree with finance.”
7. How would you find customers who never placed an order?
Sample answer: “Classic LEFT JOIN with WHERE orders.id IS NULL. I might also use NOT EXISTS for readability on large tables. Business use: marketing re-engagement lists or identifying signup funnel drop-off.”
SELECT c.id, c.name, c.email
FROM customers c
LEFT JOIN orders o ON c.id = o.customer_id
WHERE o.id IS NULL;
8. What is an index? (Conceptual)
Sample answer: “An index is a lookup structure — like a book index — that speeds up searches on large tables. More indexes mean faster reads but slower inserts. As an analyst I write filters on indexed columns (dates, IDs) and avoid WHERE YEAR(date_col) = 2025 on indexed dates because wrapping the column blocks the index — I use a date range instead.”
Excel Interview Questions for Freshers (With Detailed Answers)
Excel rounds dominate manufacturing MIS, retail operations, finance shared services, and SME roles. Expect a shared screen and a dirty CSV — not oral trivia only.
9. Difference between VLOOKUP and XLOOKUP?
Sample answer: “VLOOKUP searches the leftmost column of a table and only looks right — brittle when columns move. It defaults to approximate match unless I add FALSE. XLOOKUP is more flexible: search any direction, default exact match, return multiple columns, and show a custom message instead of #N/A. In new Excel I standardize on XLOOKUP; in legacy files I use INDEX-MATCH.”
Example: Map product_id from a sales export to a master sheet’s category column — XLOOKUP handles IDs that are not in the first column of the master.
10. What is a PivotTable?
Sample answer: “A PivotTable summarizes millions of rows into a cross-tab — for example sum of revenue by region and month — without writing separate formulas per cell. I refresh after source updates, use slicers for filters, and double-check that ‘Show values as % of grand total’ is intentional. For recurring reports I move the logic to Power Query so refresh is one click.”
11. How do you clean messy data in Excel?
Sample answer: “My checklist: remove duplicates → TRIM text → split combined columns → standardize dates with Text to Columns or DATEVALUE → fix data types (numbers stored as text) → Data Validation for categories → Power Query for repeatable steps. I never delete raw data — I add a cleaned_flag column and document assumptions in a cover sheet managers can audit.”
12. When do you use conditional formatting?
Sample answer: “To draw the eye to exceptions: KPIs below target in red, top performers in green, overdue dates highlighted. I limit rules to 2–3 meaningful conditions — rainbow spreadsheets confuse executives. For dashboards I prefer Power BI, but Excel conditional formatting is perfect for quick operational emails.”
13. Explain INDEX-MATCH (or XLOOKUP alternative).
Sample answer: “INDEX returns a value from a range; MATCH finds the position of a lookup key. Combined, they are more stable than VLOOKUP when someone inserts a column. Formula pattern: =INDEX(return_range, MATCH(lookup_value, lookup_column, 0)). I mention this shows I understand lookup mechanics, not only button clicks.”
Power BI Interview Questions for Freshers (With Detailed Answers)
Microsoft-stack companies and IT services captives frequently test Power BI modelling and DAX basics. Build depth through Power BI training plus one published capstone.

14. Star schema vs snowflake schema?
Sample answer: “In a star schema, a central fact table (sales transactions) connects directly to denormalized dimensions (product, date, customer). A snowflake splits dimensions into sub-tables (product → category → department). Star schemas are simpler for business users and faster to model for most analyst dashboards; snowflake saves storage but adds join complexity. I default to star for fresher portfolios unless the interviewer’s warehouse is already snowflaked.”
15. What is DAX? Name two measures you have built.
Sample answer: “DAX is the formula language for calculated columns and measures in Power BI. Unlike Excel, measures respect filter context from slicers and visuals. In my retail capstone I built: Total Sales = SUM(Sales[Amount]) and YoY % = DIVIDE([Total Sales] - [Sales PY], [Sales PY]) using a time intelligence column. I always explain what business question each measure answers — not only the syntax.”
16. Difference between calculated column and measure?
Sample answer: “Calculated columns are computed row-by-row at refresh and stored in the model — good for categorizing rows (e.g. ‘High/Low value’ per line item). Measures compute at query time based on current filters — correct for totals, ratios, and KPIs. Using a column for a grand total is a common beginner mistake that breaks when slicers change.”
17. How do you reduce report load time?
Sample answer: “Remove unused columns in Power Query; avoid high-cardinality fields in visuals; aggregate at source; use star schema; disable auto date/time if not needed; split large models or use aggregation tables for historical data. I test on a filtered month before publishing full history.”
18. How do you publish and share dashboards securely?
Sample answer: “Publish to a Power BI Service workspace, configure row-level security if users should only see their region, distribute via an app — never email PBIX files with production data. I use ‘Publish to web’ only for public sample datasets in portfolios.”
Statistics & Aptitude Questions (With Detailed Answers)
19. Mean vs median — when to use which?
Sample answer: “Mean is the arithmetic average — pulled by outliers like one ₹10 lakh sale among many ₹500 orders. Median is the middle value — better for skewed data such as salary bands or customer order values. I report both when presenting to finance: mean for budgets, median for ‘typical customer’ stories. Example: average order value ₹2,400 but median ₹650 means a few whales inflate the mean.”
20. Correlation vs causation?
Sample answer: “Correlation means two metrics move together; causation means one drives the other. Summer increases both ice cream sales and swimming accidents — correlated, not causal. Before recommending ‘increase X to improve Y,’ I look for controlled tests, time order, and domain logic. In interviews I say: ‘I would propose an A/B test or consult operations before claiming causation.’”
21. What is a p-value? (Basic)
Sample answer: “In hypothesis testing, the p-value is the probability of seeing a result at least as extreme as ours if the null hypothesis were true. A low p-value (often < 0.05) suggests the pattern is unlikely due to chance alone. For fresher roles I focus on explaining it in plain language — not memorizing formulas — and mention that business significance matters as much as statistical significance.”
22. How would you detect outliers?
Sample answer: “Visual: box plot or scatter chart. Statistical: IQR rule — values below Q1 − 1.5×IQR or above Q3 + 1.5×IQR. Domain rules: negative age, 200% discount. I investigate before deleting: data entry error, fraud, or a legitimate VIP customer. I document exclusions in the report footnote.”
Python Interview Questions (Entry-Level, Detailed)
Startup and product analytics roles increasingly expect Pandas basics. If you need structured hands-on practice, our Python Programming Course in Pondicherry covers core Python, Pandas, and automation — the same skills interviewers test alongside SQL and Power BI.
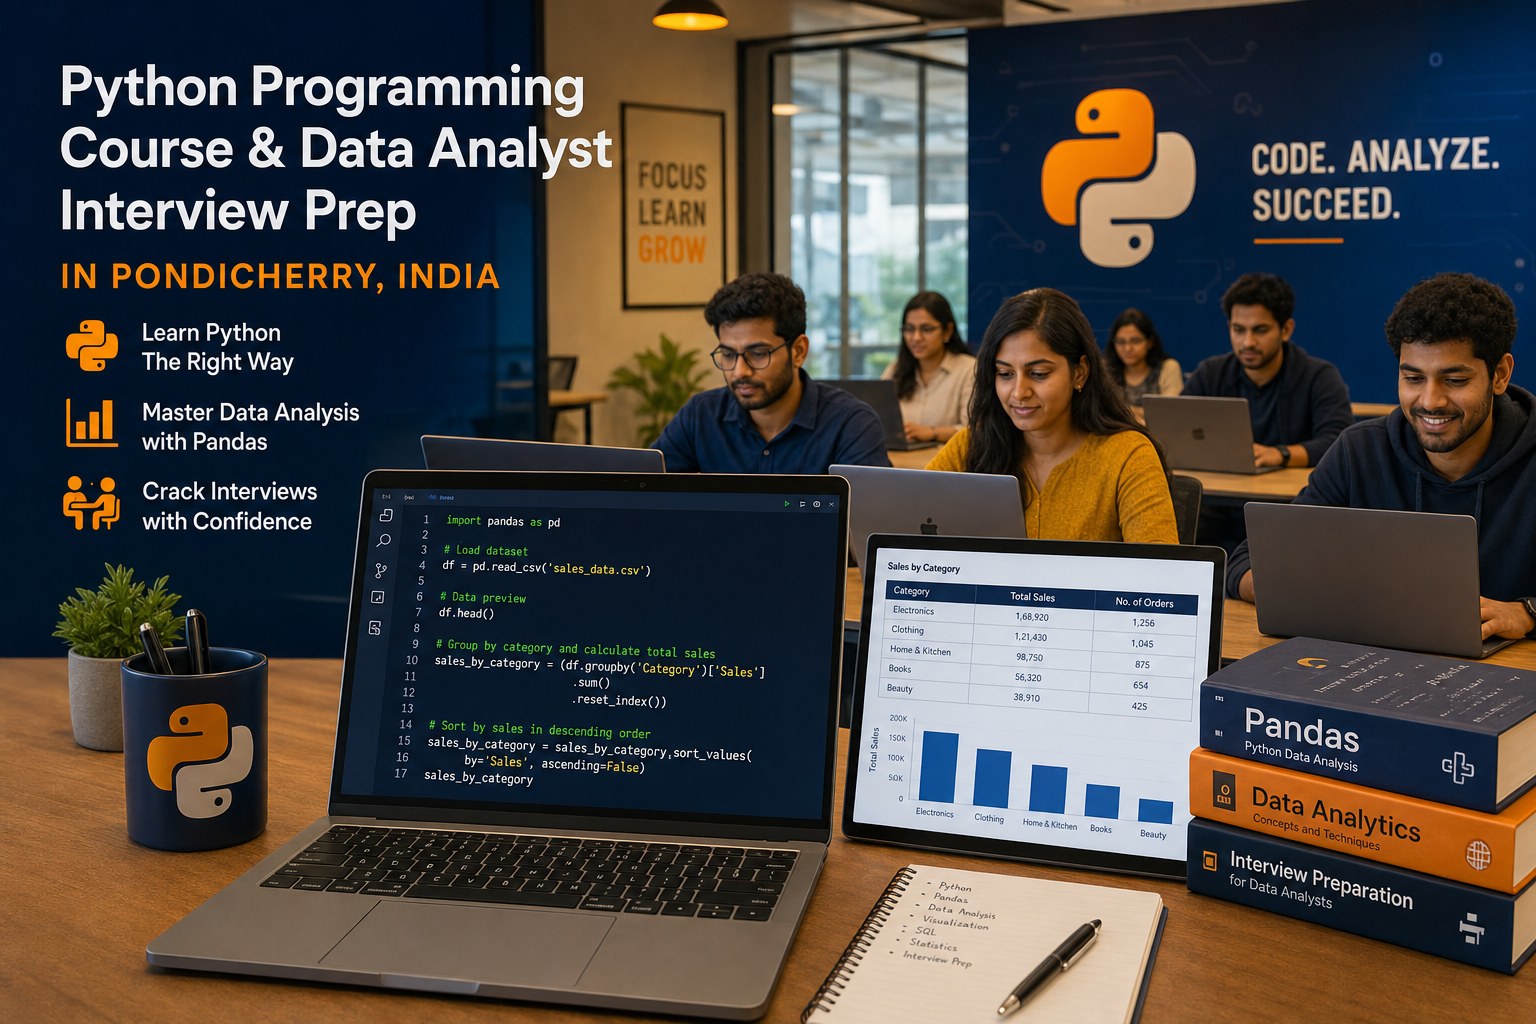
23. How do you read a CSV in Pandas?
Sample answer: “I load with pd.read_csv(), then immediately profile: df.head(), df.info() for dtypes, df.isna().sum() for missingness, and df.describe() for numeric ranges. That four-step habit prevents building charts on dirty data.”
import pandas as pd
df = pd.read_csv("sales.csv")
print(df.shape, df.isna().sum())
24. Groupby with aggregation example?
Sample answer: “Same logic as SQL GROUP BY — I use it to automate weekly regional summaries pushed to Excel or email.”
summary = (
    df.groupby("region", as_index=False)["revenue"]
    .sum()
    .sort_values("revenue", ascending=False)
)
25. How do you handle missing values?
Sample answer: “I classify missingness first: MCAR (random), MAR (related to other fields), or structural. Options: drop if <2% and random; impute median/mode with a flag column; or leave null if ‘unknown’ is honest. I never impute without telling stakeholders — it changes KPIs.”
HR & Behavioral Questions (Detailed STAR Answers)
26. Tell me about yourself.
Structure (2 minutes max):
- Present: “I am a 2025 B.Com graduate who completed hands-on training in Excel, SQL, and Power BI.”
- Past proof: “I built three portfolio projects — retail sales dashboard, HR attrition analysis, and an Excel automation that cut manual reporting time.”
- Future: “I am targeting a junior analyst or MIS role where I can support monthly reporting and grow toward BI development.”
Pro tip: Do not start from childhood. Lead with tools + outcomes.
27. Describe a project from your portfolio.
STAR example: Situation — messy retail CSV with 80k rows and inconsistent product codes. Task — monthly category performance for a manager. Action — Power Query cleaning, star schema in Power BI, DAX for YoY growth, drill-through by store. Result — identified three declining categories responsible for 60% of the drop; presented in a 5-minute walkthrough. Bring the dashboard on screen if the interview is virtual.
28. Why data analytics? Why our company?
Sample answer: “I enjoy turning numbers into decisions — in college I volunteered to analyse fest ticket sales and found which pricing tier underperformed. I chose your company because you operate in [logistics / healthcare / IT services] and I studied two public reports about your growth — I want to contribute to operational dashboards in that domain.”
29. Greatest weakness?
Sample answer: “I used to overload dashboards with too many charts. After feedback I now start every project by asking stakeholders for three KPIs and one primary action. That discipline made my capstone clearer and mirrors how I would work with a busy manager.”
30. Salary expectation for freshers?
Sample answer: “Based on Naukri and peer offers for analyst roles in [city], and given my portfolio with SQL and Power BI projects, I am targeting ₹4.5–6 LPA. I am flexible for strong mentorship and clear growth to senior analyst — can you share the band for this role?” Naming a researched range sounds confident; saying “whatever you offer” sounds unprepared.
Case Study & Take-Home Round (Elaborated)
“Sales dropped 15% last quarter — what do you check?”
- Clarify: Geography? Product line? Online vs offline? Same quarter last year (seasonality)?
- Decompose: Volume vs price vs mix; new vs returning customers.
- External: Stock-outs, competitor promos, marketing spend cuts.
- Visualize: Trend line by week, waterfall chart for drivers.
- Limitation: “I would validate with finance before recommending pricing changes.”
“Design metrics for a food delivery app.” Orders per day, AOV, delivery time P90, cancellation rate, repeat rate within 30 days, revenue per active user, cost per delivery — tie each to a team (ops, product, marketing).
How to Answer When You Have No Job Experience
Replace “no experience” with evidence of doing the job’s tasks:
- Capstone dashboards → “academic projects with real public datasets”
- College society / family business Excel tracking → domain exposure
- Quantify: “Reduced manual work from 6 hours to 45 minutes weekly”
GitHub for SQL/Python; Power BI publish links (non-sensitive data). Chennai and Bangalore recruiters often open links before round two.
7-Day Interview Prep Plan (Detailed)
- Day 1 — SQL: 20 JOIN + GROUP BY queries, timed 45 min.
- Day 2 — Excel: One dirty CSV → pivot + lookup + short commentary email.
- Day 3 — Power BI: Record a 5-minute Loom dashboard walkthrough.
- Day 4 — Stats: Flashcards + explain mean/median/correlation aloud.
- Day 5 — Behavioral: Write STAR stories for three projects; rehearse intro.
- Day 6 — Mock: Full technical mock with peer or mentor; note weak queries.
- Day 7 — Apply: Five tailored applications; match JD keywords in resume bullet one.
Our data analytics students repeat mocks until they explain every chart without reading slides — that is the bar before referrals.
10 Mistakes Freshers Make (And Fixes)
- Definitions only → Fix: open one project and walk through it.
- No clarifying questions in cases → Fix: ask scope before analysing.
- Unformatted SQL → Fix: uppercase keywords, indent JOINs.
- Wrong salary answer → Fix: research a band, stay flexible.
- Skipping thank-you email → Fix: short note within 24 hours referencing the discussion.
Mock Interviews at Asmorix Technologies
Unlimited mock panels until placement for full analytics batches: live SQL, Power BI portfolio defence, HR rehearsal, resume alignment with Naukri keywords. Book a free demo or call +91 81900 98289. Pair this guide with our career without experience roadmap.
Frequently Asked Questions
How many interview rounds do freshers face for data analyst roles?
Typically three to five: HR screening, aptitude, technical (Excel/SQL/BI), and a manager or case round. IT services may spread SQL and HR across two days; startups often combine technical skills into one 90-minute session. Ask HR for the exact flow so you can prepare the right tool.
Is SQL mandatory for data analyst interviews?
Yes for most analyst, MIS, and BI fresher roles. Even Excel-heavy positions increasingly test SELECT, JOIN, and GROUP BY because source data lives in databases. Expect at least three live queries or a timed HackerRank-style test.
What salary should freshers quote in interviews?
In 2026 India, research ₹3.5–8 LPA by city and company tier. Strong portfolios with dashboards often target ₹4.5–6.5 LPA in Tamil Nadu and remote-friendly roles. Quote a band, show flexibility for training, and ask the employer’s range before anchoring too low.
Can I crack interviews with online certificates only?
Certificates help but rarely replace demonstration. Candidates who screen-share a dashboard and explain one business insight outperform certificate-only profiles. Build two to three portfolio projects before mass applying.
How long should I prepare before applying?
With instructor-led training and daily practice, 8–10 weeks is realistic for many freshers. Self-study without mock interviews often takes 12+ months because feedback loops are missing. Start applying when you can complete five SQL questions and one dashboard walkthrough under time pressure.
Does Asmorix provide mock data analyst interviews?
Yes. Full data analytics batches include unlimited mock technical and HR rounds, resume reviews, and placement support until you accept an offer. Students practise SQL on screen, defend Power BI capstones, and receive question-by-question feedback from working analysts.
Prepare for Your First Data Analyst Interview
Join mock SQL, Excel, and Power BI panels with trainers who hire analysts in industry — free demo available.
Print this checklist: portfolio link ready, SQL editor open, two-minute intro rehearsed, three questions for the interviewer, one notebook example of a business insight you delivered. Preparation beats talent in fresher hiring cycles.
← Back to all blog posts · Career guide without experience →